Crypto mega

wpmanoj

Well-known member
  • Nov 18, 2010
    2,632
    6,384
    113
    Machan oya use karanne mokakda method eka trade karanna.
    Oya dapu ewage indicators gana ehma dakke naa.habaiy oyage trading stratergy eka supiri day trade walata..
    Day trade walata hoda monada bn.oya swing and support resistance line balala predict karalada trade karanne..
    Dawasata 100 usdt kali tikak oya wage 5-10% athare trade karanam oya karanawa wage gemak gahanna puluwan.
    Poddak me day trading eka gana kiyala dennako @wpmanoj

    මම එක්ස්පර්ට් කෙනෙක් නෙවේ. මාත් ඉගන ගන්නව නෙ. ඊයෙ හොදයි කියල හිතන් හිටපුව මම අද වෙනස් කරනවා. ඔක්කොම ඉතින් ලැබෙන අත්දැකිම් උඩ. මේ වෙද්දි මගේ ක්‍රමය මේකයි.

    මුලින්ම මෙන්න මේ මූලික පැටර්න් ටික ඔලුවට දාගන්න ඕන.

    patterns-forex_1000x545.jpg


    මචං මම මුලින්ම කරන්නෙ ඩේ චාට් එක දාල බලනව ලොකු පින්තූරෙ තියෙනව එතන. ඒකෙ මේ පැටන් එකක් ෆොම් වෙනවද බලනව. එහෙම අදුර ගන්න බැරි නම් පැය හතර නැතිනම් පැය ඔහොම පහලට බහිනවා.

    ලොකු පින්තූරෙ අනුව උඩ තියන රටාවක් ඇදිල අනිවාර්ය ඉහල යෑමක් පේනවා නම් වැඩේ පටන් ගන්නවා.

    ඊලගට කරන්නේ ට්රෙන්ඩ් ලයින් අදින්න ගන්නවා. ට්රෙන්ඩ් ලයින් කියන්නෙ මුදුන් සහ බොටම් යාකර කර අදින ලයින්. මේවා අංශක 360 ම තියනවා. ඒ ලයින් අනුව අපිට නවතින තැන් වගේම පහල බහින තැන් හිතා ගන්නත් මුලින්ම පෙන්නුව රටා අදුර ගන්නත් පුළුවන්.

    අන්තිමට තමයි මම ට්රේඩ් කරන්නේ. අර ගහපු ට්රෙන්ඩ් ලයින් අනුව හිතා ගන්නවා උඩටම එන තැන වගේම පහලටම බහින තැන. උඩටම යනකන් ඉන්නෙ නැතුව මම කලින් අයින් වෙනවා. උදා හිතමු 4% අප් එකක් කියල. මේක ඉරහද වගේ ෂුවර් උනත් 3-4% අතර තියන මොකක් හරි මුලින්ම අහුවෙන රෙසිස්ටන් ලයින් එකෙන් මම බැස්සා. හැබැයි සල්ලි දීල නම් ගන්නේ එන්න පුළුවන් පහල තැනට ආවම එතනින් ච්ට්ටක් යටින් මම දාන්නෙ. කැන්ඩ්ල් ක්ලෝස් වෙන්නෙ ට්රෙන්ඩ් ලයින් එක් උනාට ලෝ එක පහලට දුවනවා.

    සරලවම ඔන්න ඕකයි කථාව
     

    visalbro

    Well-known member
  • Jun 4, 2017
    15,974
    17,129
    113
    panadura
    මම එක්ස්පර්ට් කෙනෙක් නෙවේ. මාත් ඉටගන ගන්නව නෙ. ඊයෙ හොදයි කියල හිතන් හිටපුව මම අද වෙනස් කරනවා. ඔක්කොම ඉතින් ලැබෙන අත්දැකිම් උඩ. මේ වෙද්දි මගේ ක්‍රමය මේකයි.

    මුලින්ම මෙන්න මේ මූලික පැටර්න් ටික ඔලුවට දාගන්න ඕන.

    patterns-forex_1000x545.jpg


    මචං මම මුලින්ම කරන්නෙ ඩේ චාට් එක දාල බලනව ලොකු පින්තූරෙ තියෙනව එතන. ඒකෙ මේ පැටන් එකක් ෆොම් වෙනවද බලනව. එහෙම අදුර ගන්න බැරි නම් පැය හතර නැතිනම් පැය ඔහොම පහලට බහිනවා.

    ලොකු පින්තූරෙ අනුව උඩ තියන රටාවක් ඇදිල අනිවාර්ය ඉහල යෑමක් පේනවා නම් වැඩේ පටන් ගන්නවා.

    ඊලගට කරන්නේ ට්රෙන්ඩ් ලයින් අදින්න ගන්නවා. ට්රෙන්ඩ් ලයින් කියන්නෙ මුදුන් සහ බොටම් යාකර කර අදින ලයින්. මේවා අංශක 360 ම තියනවා. ඒ ලයින් අනුව අපිට නවතින තැන් වගේම පහල බහින තැන් හිතා ගන්නත් මුලින්ම පෙන්නුව රටා අදුර ගන්නත් පුළුවන්.

    අන්තිමට තමයි මම ට්රේඩ් කරන්නේ. අර ගහපු ට්රෙන්ඩ් ලයින් අනුව හිතා ගන්නවා උඩටම එන තැන වගේම පහලටම බහින තැන. උඩටම යනකන් ඉන්නෙ නැතුව මම කලින් අයින් වෙනවා. උදා හිතමු 4% අප් එකක් කියල. මේක ඉරහද වගේ ෂුවර් උනත් 3-4% අතර තියන මොකක් හරි මුලින්ම අහුවෙන රෙසිස්ටන් ලයින් එකෙන් මම බැස්සා. හැබැයි සල්ලි දීල නම් ගන්නේ එන්න පුළුවන් පහල තැනට ආවම එතනින් ච්ට්ටක් යටින් මම දාන්නෙ. කැන්ඩ්ල් ක්ලෝස් වෙන්නෙ ට්රෙන්ඩ් ලයින් එක් උනාට ලෝ එක පහලට දුවනවා.

    සරලවම ඔන්න ඕකයි කථාව
    Ah godak thanks machan...
    RSI,MACD ehema balanne nadda??
     
    • Like
    Reactions: wpmanoj

    wpmanoj

    Well-known member
  • Nov 18, 2010
    2,632
    6,384
    113
    Ah godak thanks machan...
    RSI,MACD ehema balanne nadda??
    ඒව බලන්න ඕන. ඒත් දැන් නම් මගේ අවධානෙ වැඩිය යන්නෙ නෑ. තව ඉගෙන ගනිද්දි ඒවයින් ගන්න ඕන වැඩ වගේම ක්‍රමයත් ඔලුවට දාගන්න පුවවන් වේවි. දැනට මම බලන්නේ වොලියුම් එක තමයි. වොලියුම් එකේ ලොකු කථාවක් යනවා. විශේෂයෙන් ට්රේඩර්ස්ලාගෙ හිතේ තියන දේ. RSI වලින් නම් වැඩක් ගැනෙනව අඩුයි.
     
    • Like
    Reactions: BadBlueGenius

    visalbro

    Well-known member
  • Jun 4, 2017
    15,974
    17,129
    113
    panadura
    ඒව බලන්න ඕන. ඒත් දැන් නම් මගේ අවධානෙ වැඩිය යන්නෙ නෑ. තව ඉගෙන ගනිද්දි ඒවයින් ගන්න ඕන වැඩ වගේම ක්‍රමයත් ඔලුවට දාගන්න පුවවන් වේවි. දැනට මම බලන්නේ වොලියුම් එක තමයි. වොලියුම් එකේ ලොකු කථාවක් යනවා. විශේෂයෙන් ට්රේඩර්ස්ලාගෙ හිතේ තියන දේ. RSI වලින් නම් වැඩක් ගැනෙනව අඩුයි.
    Machan thanks...
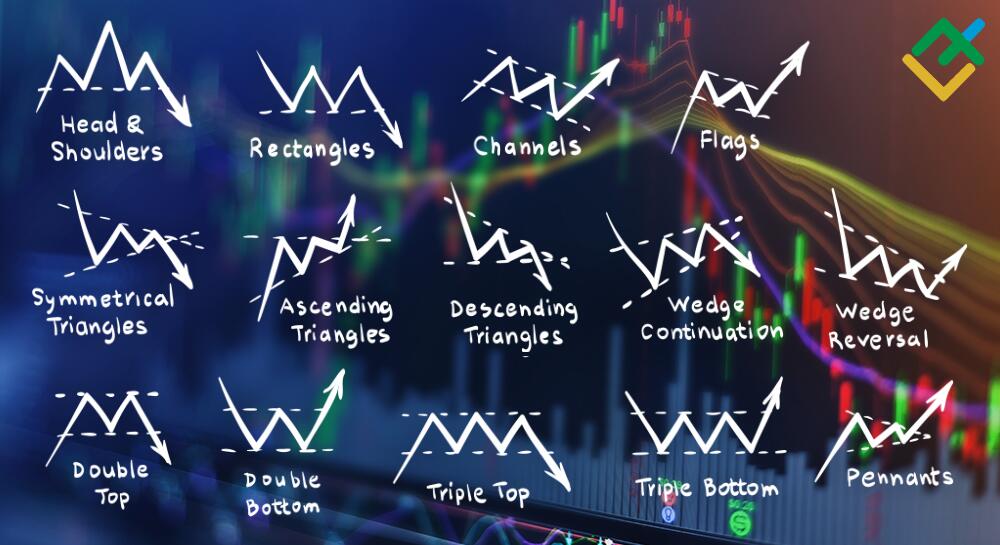
    Oya pattern tikak kal baluwanam hari kohomada up down yanne kiyala hithaganna puluwan.
    Ubage stratergy eka nm ela.
    Volume ekenuiy order book ekaiy dekenma kathawak kiyanne...mata nm thama eka note une naa

    👇👇Copid from quoura

    Volume can tell you a lot about the market psychology that’s not immediately obvious from the price action data alone, and therefore it is one of the primary indicators for technical traders.

    An example of this is when you look at a sequence of volume bars over time, say after a big breakout to the upside. If the price action stops climbing, and enters a period of consolidation, look for declining volume on the way down to indicate “healthy” consolidation, forming what is known as a bull flag. Increasing red volume would be a more worrying sign here, potentially indicating that the price is not very stable at these levels and more and more sellers are appearing, leading to a potential reversal. The same can be applied after a big market dump. If the price starts slowly rising again but the green volume is declining at the same time (bear flag pattern), we can say there is not a lot of momentum behind this rise and it will most likely fizzle out and return to bearish continuation.

    Decreasing or increasing volume can also be used to determine the likelihood of a support or resistance level breaking. The analogy often used here is that of a car approaching a brick wall. If the car is slowing down as it approaches the wall, it is unlikely to have the momentum to break through. But if it is speeding up, chances are it will smash the wall down. The car in this case is the volume, and the wall is the S/R level. Pay close attention to the volume as the price approaches key levels to determine the likelihood of the level breaking or holding. Increasing volume on the approach increases the odds of a break.

    Another great way to use volume is to look for “volume climaxes” to indicate potential market reversals. These climaxes tend to happen at the extremes, either at tops or bottoms. At bottoms, after prices have been falling for some time, there comes a point where the market gets more and more fearful and selling activity and stop losses triggering increases rapidly. At a certain point, more and more buyers start to step in to snap up coins at what they perceive to be bargain-basement prices, so we’ve got a lot of selling, and at the same time a lot of buying activity starts to occur, causing the price drop to come to a stand-still right at the point where the buying pressure equals the selling pressure, and eventually the prices start to rise again after sellers have exhausted themselves. The volume indicator typically shows this as a very clear, distinct peak with volume often 100%+ higher than the preceding candle period, and this can be a high-odds indicator that this particular level is likely to be a turning point for the price action, even if sometimes only temporarily. The same principle can be applied for market tops as well of course, where maximum FOMO, or fear of missing out, meets heavy selling from those already in positions and starting to take profits, until the price starts to drop again.

    Abnormal volume, i.e volume when there previously was not much market activity - and while price action is relatively flat or stable - can sometimes foreshadow that a breakout is about to happen. This is the result of bears fighting bulls for a while, each side trying to keep the price from going against them, until one side eventually loses. We can’t always predict in which direction it will break, but traders often say “volume precedes price action”, so look out for abnormal volume and be ready for potential price volatility. We have actually built an abnormal volume alert as part of our crypto alerts system, which is sensitive to this kind of event, as well as some of the scenarios described above, and it is certainly fascinating to watch in action!

    Hopefully this helps you understand more about how volume can be used to influence trading decisions, ideally coupled with other indicators such as RSI and price level analysis.
     
    Last edited:

    sdlrs6

    Well-known member
  • Feb 20, 2008
    30,449
    921
    113
    34
    In the Sky
    දැන් 50% ටයිම් ට්රේඩින්. පෙබරවාරි වෙනකන් මගේ ප්රොජෙක්ට් කීපයක් ඉවර කරන්න බැරි වෙනවා. උපරිම උත්සහ කලා ඉවර කරන්න ඒත් ටයිම් මදි මචං. අනිවාර්යෙන් ට්රේඩිං තමයි මගේ ෆුල් ටයිම් වෙන්නේ.

    බොට් හදන්න හැම දේම සූදානම්. කොයින් 2000 ක all time 1 minit data download කරලා තියෙන්නේ. කෝඩ් කොටන්න තමයි තියෙන්නේ. බලමු මගේ AI වැඩ කරයිද කියලා. ලාබයක් එනවා නම් අනිවාර්යෙන් එලකිරි ඩයල් 10 කට බොට්ගෙ සිග්නල් කිසිම වියදමක් නැතුව දෙනවා. සිග්නල් විකුනන්ණෙ නම් නෑ කීයකට වත්.

    සිග්නල් ලැබෙන 10 ට ඉන්වෙස්ට් කරලා මැරෙනකම්ම කිසිම වැඩක් නොකර ඉන්න පුවවන් වේවා. මැරෙනකම්ම සිග්නල් කිසිම වියදමක් නැතුව දෙනවා. <3
    Matath oya pattern study karanna ona ban
    Forex walath podi ganak danata dala thiyenne man
     
    • Like
    Reactions: wpmanoj

    wpmanoj

    Well-known member
  • Nov 18, 2010
    2,632
    6,384
    113
    coin buy karana වෙලාව තිරණය කරන්න පුළුවන් හොදම විදිහ කොහොමද ,මේකට අදුනිකයි තවම ඉතින් මේ ප්‍රශ්න ඉවසා වදාරන්න
    නියම විදිය හොයා ගන්නෙ කොහොමද නම් දන්නෙ නෑ. මම නම් කරන්නෙ විනාඩි 15 වගේ චාට් එකක ට්රෙන්ඩ් ලයින් අදිනව. ඒ ට්රෙන්ඩ් ලයින් වලින් තමයි ගොඩක් වෙලාට ටොප් බොටම් ගැන යම් අදහසක් ගන්නේ. හැදීගෙන එන පැටන් අනුව උඩටද පහලට හිතා ගන්න පුළුවන්.

    ඒවගේ පහලට යද්දි කොච්චර වගේ යයිදත් යම් අදහසක් ගන්න පුවවන්. නිකමට එලියට වේව් එකක් කියල හිතන්න. පලමු දෙවනි ස්වින්ග් දෙක ආවා. ඒ දෙක 10% ගානෙ දෙකක් නම් බොහෝවිට තුනත් ඒ හා සමානයි. ඉතින් අපි කරන්නේ දෙකේ පහල ඉදන් 10% ක් විතර උඩට මාක් කරලා ඒ ලගින් යන ප්රභල ට්රෙන්ඩ් ලයින් ගැන බලනවා. කිට්ටුව එහෙම එකක් යනවානම් බොහෝ විට ටොප් එක ඒක තමයි.

    පැටර්න් එකින් එකට විදිය වෙනස් වෙනවා. මම කලින් උඩ දාපු මූලික පැටන් ටික හරිම වැදගත්. ඒවා 100% ක් විතර ෂුවර් ඒවා. එහෙම පැටර්න් එකක් ෆෝර්ම් උනාම අනිවාර්යෙන්ම වගේ එහෙම වෙනවා. නොවීමේ සම්බාවිතාව බොහොම වරලයි
     

    BadBlueGenius

    Well-known member
  • Jun 11, 2014
    5,524
    6,499
    113
    නියම විදිය හොයා ගන්නෙ කොහොමද නම් දන්නෙ නෑ. මම නම් කරන්නෙ විනාඩි 15 වගේ චාට් එකක ට්රෙන්ඩ් ලයින් අදිනව. ඒ ට්රෙන්ඩ් ලයින් වලින් තමයි ගොඩක් වෙලාට ටොප් බොටම් ගැන යම් අදහසක් ගන්නේ. හැදීගෙන එන පැටන් අනුව උඩටද පහලට හිතා ගන්න පුළුවන්.

    ඒවගේ පහලට යද්දි කොච්චර වගේ යයිදත් යම් අදහසක් ගන්න පුවවන්. නිකමට එලියට වේව් එකක් කියල හිතන්න. පලමු දෙවනි ස්වින්ග් දෙක ආවා. ඒ දෙක 10% ගානෙ දෙකක් නම් බොහෝවිට තුනත් ඒ හා සමානයි. ඉතින් අපි කරන්නේ දෙකේ පහල ඉදන් 10% ක් විතර උඩට මාක් කරලා ඒ ලගින් යන ප්රභල ට්රෙන්ඩ් ලයින් ගැන බලනවා. කිට්ටුව එහෙම එකක් යනවානම් බොහෝ විට ටොප් එක ඒක තමයි.

    පැටර්න් එකින් එකට විදිය වෙනස් වෙනවා. මම කලින් උඩ දාපු මූලික පැටන් ටික හරිම වැදගත්. ඒවා 100% ක් විතර ෂුවර් ඒවා. එහෙම පැටර්න් එකක් ෆෝර්ම් උනාම අනිවාර්යෙන්ම වගේ එහෙම වෙනවා. නොවීමේ සම්බාවිතාව බොහොම වරලයි
    Binance charts online site එකේ බලන්නේ නැතුව mt4 එකට දාන්න පුලුවන්ද ?
     
    • Like
    Reactions: wpmanoj